Player Performance Data (Taken from LCK 2025 Round 1-2)
| Player | Role | GP Games Played |
W Wins |
L Losses |
W% Win Rate |
KDA Kill/Death/Assist Ratio |
K Kills |
D Deaths |
A Assists |
CS Creep Score |
Gold Gold Earned |
DMG Damage Dealt |
|---|---|---|---|---|---|---|---|---|---|---|---|---|
| Ruler | Bot | 41 | 36 | 5 | 87.80% | 8.33 | 6.15 | 1.49 | 6.24 | 311 | 15.1k | 23.4k |
| Chovy | Mid | 41 | 36 | 5 | 87.80% | 7.33 | 4.20 | 1.63 | 7.78 | 300 | 14.1k | 24.0k |
| Duro | Support | 41 | 36 | 5 | 87.80% | 6.44 | 0.71 | 2.12 | 12.95 | 23 | 8.1k | 5.6k |
| Canyon | Jungle | 41 | 36 | 5 | 87.80% | 6.35 | 3.27 | 1.95 | 9.12 | 223 | 12.1k | 14.4k |
| Aiming | Bot | 49 | 25 | 24 | 51.02% | 6.32 | 4.20 | 1.67 | 6.37 | 317 | 14.6k | 21.9k |
| Viper | Bot | 40 | 29 | 11 | 72.50% | 5.59 | 4.97 | 2.00 | 6.20 | 309 | 14.4k | 23.6k |
| Cuzz | Jungle | 47 | 25 | 22 | 53.19% | 5.19 | 3.19 | 2.21 | 8.30 | 215 | 11.9k | 15.0k |
| Kiin | Top | 41 | 36 | 5 | 87.80% | 5.17 | 3.51 | 2.00 | 6.83 | 261 | 13.0k | 20.7k |
| Bdd | Mid | 47 | 25 | 22 | 53.19% | 4.80 | 3.89 | 2.13 | 6.32 | 289 | 13.5k | 21.5k |
| Faker | Mid | 41 | 25 | 16 | 60.98% | 4.76 | 3.41 | 2.15 | 6.80 | 290 | 13.6k | 22.7k |
| Oner | Jungle | 41 | 25 | 16 | 60.98% | 4.67 | 3.88 | 2.59 | 8.20 | 231 | 12.8k | 17.0k |
| Smash | Bot | 8 | 5 | 3 | 62.50% | 4.65 | 5.38 | 2.50 | 6.25 | 308 | 14.4k | 23.6k |
| Gumayusi | Bot | 33 | 20 | 13 | 60.61% | 4.64 | 4.39 | 2.42 | 6.85 | 322 | 15.2k | 23.5k |
| ShowMaker | Mid | 49 | 25 | 24 | 51.02% | 4.48 | 3.53 | 2.31 | 6.80 | 280 | 13.3k | 20.5k |
| Zeka | Mid | 40 | 29 | 11 | 72.50% | 4.48 | 3.90 | 2.30 | 6.40 | 289 | 13.6k | 22.9k |
| Keria | Support | 41 | 25 | 16 | 60.98% | 4.21 | 0.73 | 2.85 | 11.29 | 35 | 8.4k | 7.2k |
| Peanut | Jungle | 40 | 29 | 11 | 72.50% | 4.15 | 2.88 | 2.73 | 8.43 | 208 | 11.7k | 13.9k |
| Delight | Support | 40 | 29 | 11 | 72.50% | 4.15 | 0.70 | 2.95 | 11.55 | 41 | 8.4k | 6.4k |
| Bull | Bot | 8 | 4 | 4 | 50.00% | 4.05 | 4.00 | 2.38 | 5.62 | 324 | 14.9k | 21.9k |
| Calix | Mid | 36 | 18 | 18 | 50.00% | 3.94 | 3.17 | 2.14 | 5.25 | 276 | 12.9k | 18.7k |
| Clozer | Mid | 86 | 35 | 51 | 40.70% | 3.91 | 2.99 | 2.30 | 6.01 | 289 | 12.9k | 20.2k |
| Lucid | Jungle | 49 | 25 | 24 | 51.02% | 3.77 | 3.16 | 2.86 | 7.61 | 202 | 11.5k | 13.2k |
| Hype | Bot | 38 | 13 | 25 | 34.21% | 3.69 | 3.79 | 2.21 | 4.37 | 302 | 13.4k | 19.9k |
| Daystar | Mid | 8 | 3 | 5 | 37.50% | 3.68 | 3.00 | 2.75 | 7.12 | 245 | 11.7k | 17.3k |
| Jiwoo | Bot | 41 | 23 | 18 | 56.10% | 3.51 | 4.07 | 2.76 | 5.61 | 278 | 13.4k | 21.9k |
| Fisher | Mid | 9 | 6 | 3 | 66.67% | 3.48 | 2.44 | 2.56 | 6.44 | 294 | 13.4k | 20.7k |
| Diable | Bot | 46 | 17 | 29 | 36.96% | 3.45 | 4.28 | 2.72 | 5.09 | 293 | 13.6k | 22.7k |
| PerfecT | Top | 28 | 18 | 10 | 64.29% | 3.45 | 2.61 | 2.39 | 5.64 | 250 | 12.3k | 17.5k |
| kyeahoo | Mid | 4 | 1 | 3 | 25.00% | 3.44 | 3.00 | 2.25 | 4.75 | 327 | 15.4k | 21.5k |
| GIDEON | Jungle | 45 | 24 | 21 | 53.33% | 3.39 | 2.98 | 3.09 | 7.49 | 190 | 11.3k | 13.2k |
| Berserker | Bot | 42 | 8 | 34 | 19.05% | 3.30 | 3.07 | 2.17 | 4.07 | 312 | 13.7k | 20.6k |
| Croco | Jungle | 63 | 27 | 36 | 42.86% | 3.28 | 3.10 | 3.08 | 7.02 | 217 | 11.7k | 14.1k |
| vital | Bot | 4 | 1 | 3 | 25.00% | 3.29 | 2.25 | 1.75 | 3.50 | 291 | 12.4k | 24.0k |
| Siwoo | Top | 49 | 25 | 24 | 51.02% | 3.21 | 2.96 | 2.39 | 4.71 | 269 | 12.8k | 19.9k |
| Zeus | Top | 40 | 29 | 11 | 72.50% | 3.21 | 4.30 | 3.20 | 5.97 | 269 | 13.6k | 23.2k |
| Peter | Support | 47 | 25 | 22 | 53.19% | 3.20 | 0.70 | 3.45 | 10.32 | 34 | 8.1k | 6.5k |
| LazyFeel | Bot | 23 | 9 | 14 | 39.13% | 3.04 | 3.61 | 2.91 | 5.26 | 300 | 14.1k | 21.0k |
| Raptor | Jungle | 46 | 17 | 29 | 36.96% | 2.84 | 3.04 | 3.35 | 6.48 | 195 | 11.0k | 14.6k |
| Kingen | Top | 45 | 24 | 21 | 53.33% | 2.80 | 3.09 | 2.82 | 4.82 | 256 | 12.8k | 21.4k |
| Doran | Top | 41 | 25 | 16 | 60.98% | 2.75 | 3.51 | 3.46 | 6.02 | 272 | 13.6k | 20.9k |
| BeryL | Support | 49 | 25 | 24 | 51.02% | 2.69 | 0.67 | 3.88 | 9.78 | 42 | 8.1k | 7.0k |
| Morgan | Top | 86 | 35 | 51 | 40.70% | 2.68 | 2.47 | 2.72 | 4.81 | 257 | 12.1k | 18.6k |
| HamBak | Jungle | 18 | 7 | 11 | 38.89% | 2.64 | 1.61 | 3.06 | 6.44 | 203 | 10.7k | 12.3k |
| Kellin | Support | 46 | 17 | 29 | 36.96% | 2.62 | 0.70 | 3.78 | 9.22 | 29 | 7.5k | 6.7k |
| Clear | Top | 36 | 14 | 22 | 38.89% | 2.57 | 2.53 | 2.83 | 4.75 | 249 | 12.1k | 18.9k |
| ucal | Mid | 37 | 12 | 25 | 32.43% | 2.53 | 2.95 | 3.08 | 4.84 | 294 | 13.1k | 19.8k |
| Pollu | Support | 46 | 17 | 29 | 36.96% | 2.52 | 0.30 | 3.52 | 8.57 | 29 | 7.4k | 5.8k |
| VicLa | Mid | 38 | 14 | 24 | 36.84% | 2.52 | 2.58 | 3.37 | 5.92 | 266 | 12.2k | 20.7k |
| Ellim | Jungle | 5 | 1 | 4 | 20.00% | 2.50 | 3.00 | 3.20 | 5.00 | 212 | 11.8k | 12.9k |
| Teddy | Bot | 18 | 4 | 14 | 22.22% | 2.50 | 2.67 | 2.56 | 3.72 | 299 | 12.7k | 18.2k |
| Casting | Top | 19 | 7 | 12 | 36.84% | 2.34 | 2.37 | 3.21 | 5.16 | 240 | 11.8k | 20.4k |
| Pyosik | Jungle | 39 | 7 | 32 | 17.95% | 2.33 | 2.05 | 3.23 | 5.49 | 205 | 11.1k | 11.5k |
| BuLLDoG | Mid | 32 | 6 | 26 | 18.75% | 2.20 | 1.81 | 3.12 | 5.06 | 284 | 12.5k | 21.7k |
| Sponge | Jungle | 41 | 13 | 28 | 31.71% | 2.18 | 2.85 | 3.95 | 5.76 | 209 | 11.5k | 14.3k |
| Soboro | Top | 10 | 3 | 7 | 30.00% | 2.14 | 3.00 | 3.60 | 4.70 | 233 | 11.5k | 17.6k |
| Lehends | Support | 45 | 24 | 21 | 53.33% | 2.13 | 1.02 | 4.58 | 8.71 | 33 | 7.9k | 7.2k |
| Paduck | Bot | 8 | 3 | 5 | 37.50% | 2.08 | 2.62 | 3.25 | 4.12 | 267 | 12.0k | 16.1k |
| Rich | Top | 41 | 13 | 28 | 31.71% | 2.07 | 2.63 | 3.32 | 4.22 | 260 | 12.4k | 21.0k |
| Andil | Support | 31 | 11 | 20 | 35.48% | 1.99 | 0.48 | 4.35 | 8.19 | 29 | 7.6k | 6.5k |
| Pleata | Support | 10 | 2 | 8 | 20.00% | 1.85 | 0.40 | 4.00 | 7.00 | 31 | 7.2k | 5.2k |
| DuDu | Top | 42 | 8 | 34 | 19.05% | 1.84 | 2.33 | 3.12 | 3.40 | 266 | 12.2k | 18.4k |
| DDoiV | Jungle | 3 | 1 | 2 | 33.33% | 1.77 | 3.67 | 4.33 | 4.00 | 205 | 11.3k | 11.9k |
| Life | Support | 42 | 8 | 34 | 19.05% | 1.66 | 0.62 | 4.36 | 6.62 | 33 | 7.6k | 6.0k |
| Pungyeon | Mid | 10 | 2 | 8 | 20.00% | 1.19 | 1.80 | 4.20 | 3.20 | 278 | 11.8k | 18.2k |
KDA Comparison By Player
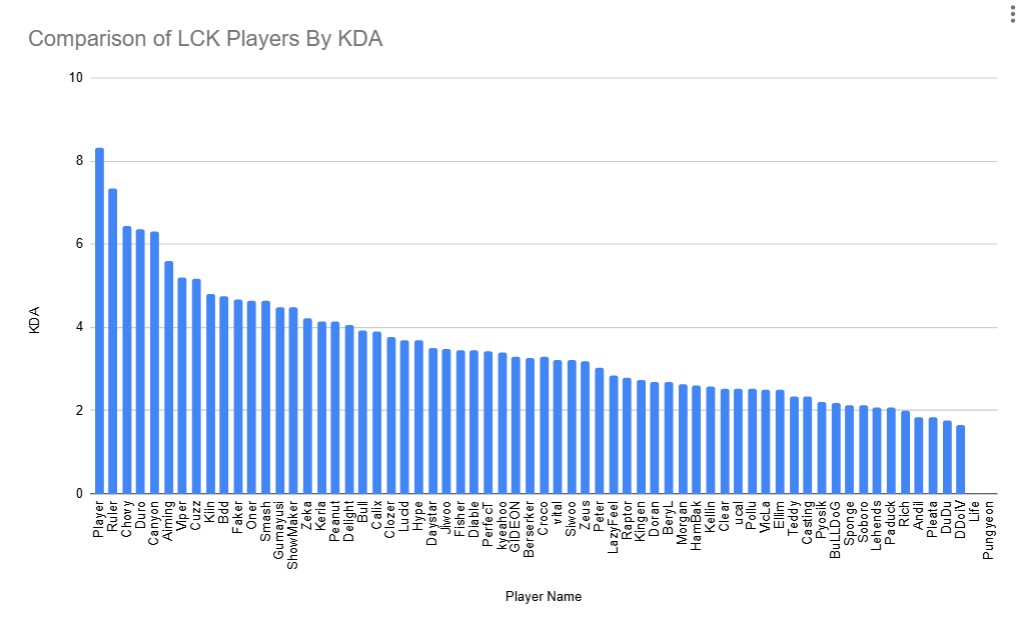
This bar chart answers the most direct question: "Who are the best individual performers?" This shows the average individual performance of players as KDA is one of the biggest indicators of relative performance during a game. This chart is effective as it allows you to see relative player rankings as it is hard to measure individual performance in a team game. A bar chart is probably the most effective way to visualize this data. As it is relatively easy to see the KDA gap between players.
KDA Comparison to Win Rate
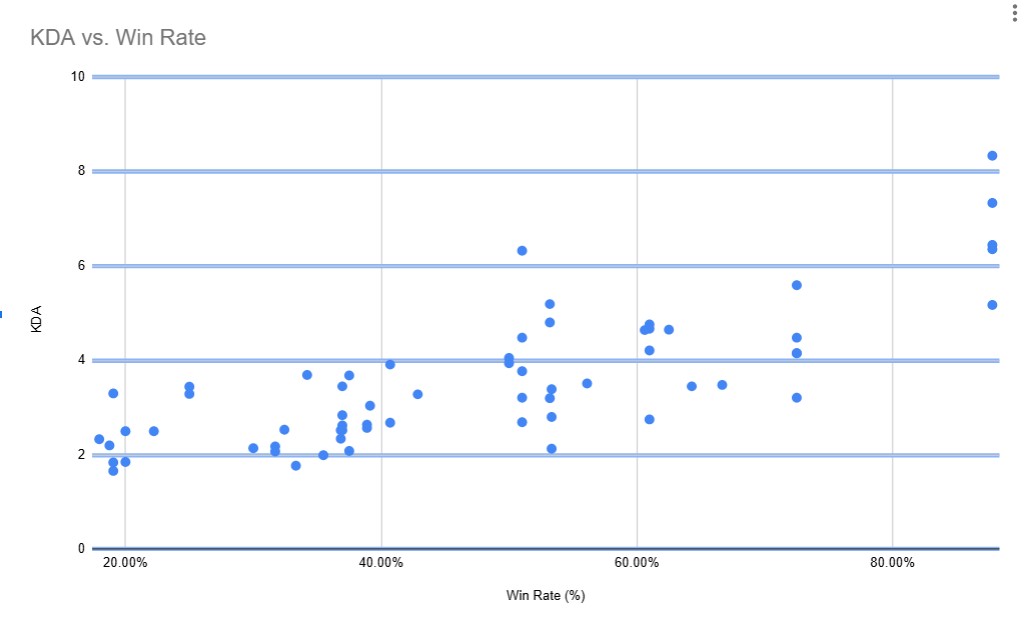
This scatter plot seeks to find a correlation between individual skill (KDA) and team success (Win Rate). Each dot on the chart represents one player from the dataset. This graph shows a strong positive correlation, indicating that KDA may have a significant impact on the outcome of the team. However, the chart also shows important outliers indicating that a player's individual performance can only carry the team so far. The scatter plot is probably the best way to look at correlation because it displays each point as an individual dot and allows you to draw conclusions based on the dots.
Damage Comparison by Role
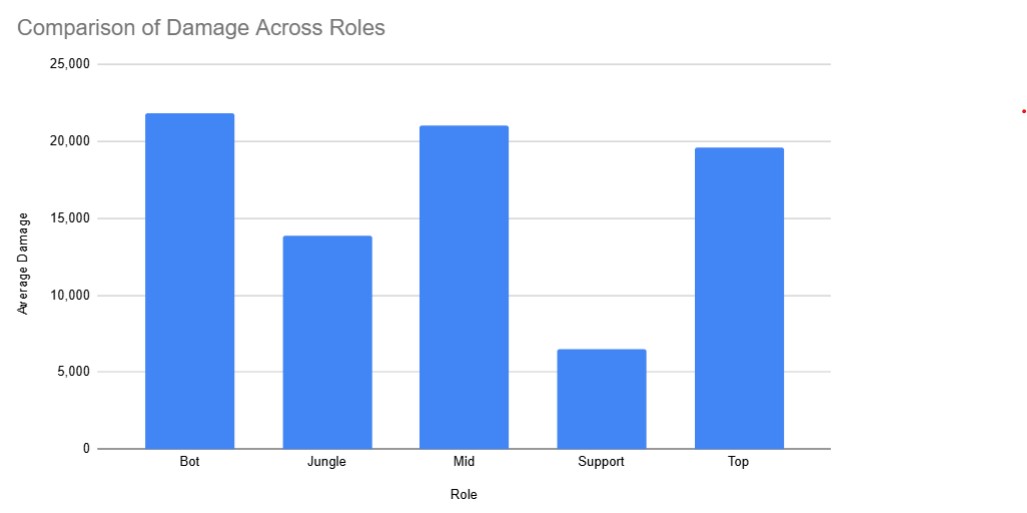
This chart shifts the focus from individual players to player *roles*. It answers the question: "Which roles are responsible for dealing the most damage?" This was created by averaging the 'DMG' column for all players within each of the five roles. The results show that mid laners and bot laners (ADCs) deal the most damage. The bar chart allows for easy comparisons visually. It allows us to come to a conclusion and further identify the jobs of each role in game.